
CRM Optimization for Distributors: How to Improve Sales and Visibility
Most distributors already use a CRM, but they don’t get the visibility they expect from it. Data lives in different systems, reps track work outside the CRM, and leaders can’t rely on the numbers. In this article, we break down why CRM optimization matters, the metrics you need to track, the steps to build a system sales teams will use, and the pitfalls to avoid.
Why CRM Optimization Is Critical for Distribution Businesses
Wholesale trade spends more than USD $1.27B a year on CRM, yet most distributors still struggle with siloed data, inconsistent usage, and low visibility into accounts [1].
Unique distribution challenges driving the need for CRM optimization
Reps juggle contract pricing, long reorder cycles, thousands of SKUs, and constant coordination with inside sales and branches. Add in territory shifts, service requests, and inventory swings, and the CRM has to mirror a sales motion tightly intertwined with operational processes, unlike in other industries. Most systems aren’t configured for that level of detail.
How generic CRM configurations fall short for distributors
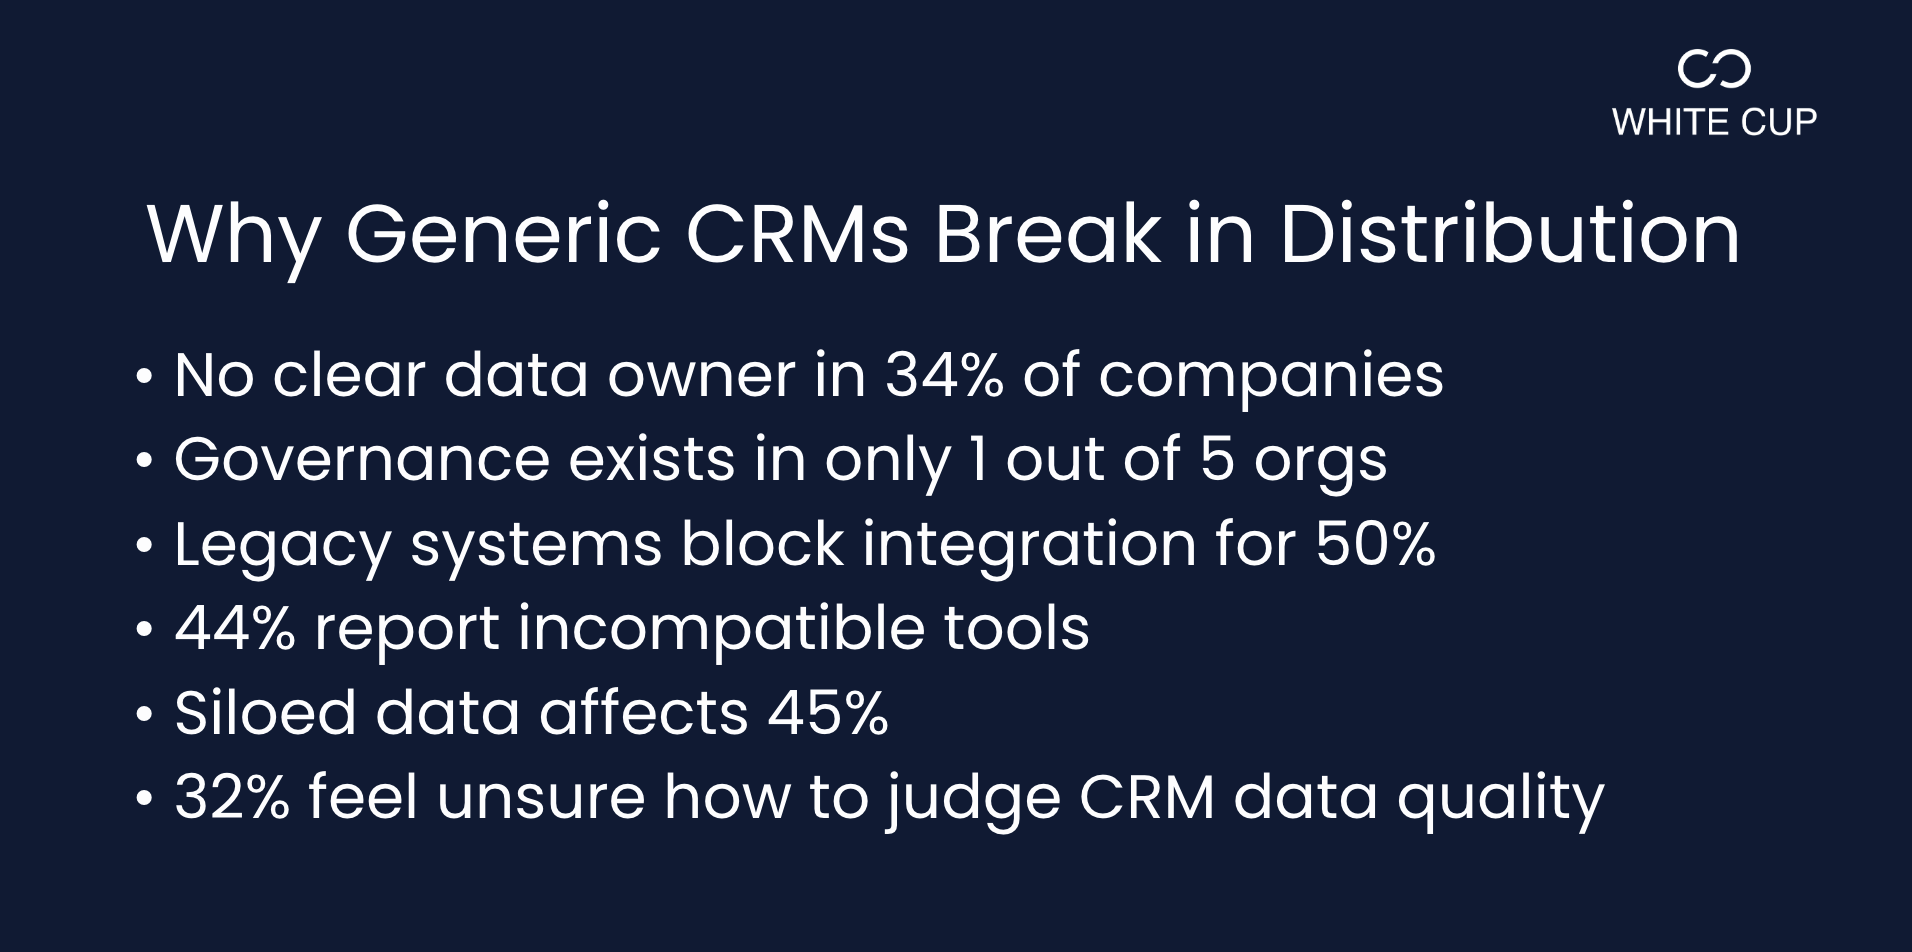
Most generic CRMs fail because the data foundation is broken long before sales teams ever touch the system. 34% of companies don’t know who owns CRM data, and almost half don’t have anyone dedicated to maintaining data quality[2].
With ownership unclear, only 20% have formal governance, so structure and consistency collapse fast. Add the tech stack: 50% cite legacy systems that are hard to integrate, and 44% agree their tools can’t communicate effectively. The result is predictable[2].
45% struggle with siloed data, and one in three users doesn’t know how to assess CRM data quality at all[2]. For distributors who rely on ERP accuracy, inventory signals, pricing rules, and long account histories, these gaps make a generic CRM unusable.
The revenue risk of low-visibility sales pipelines, missed follow-up, and disconnected data
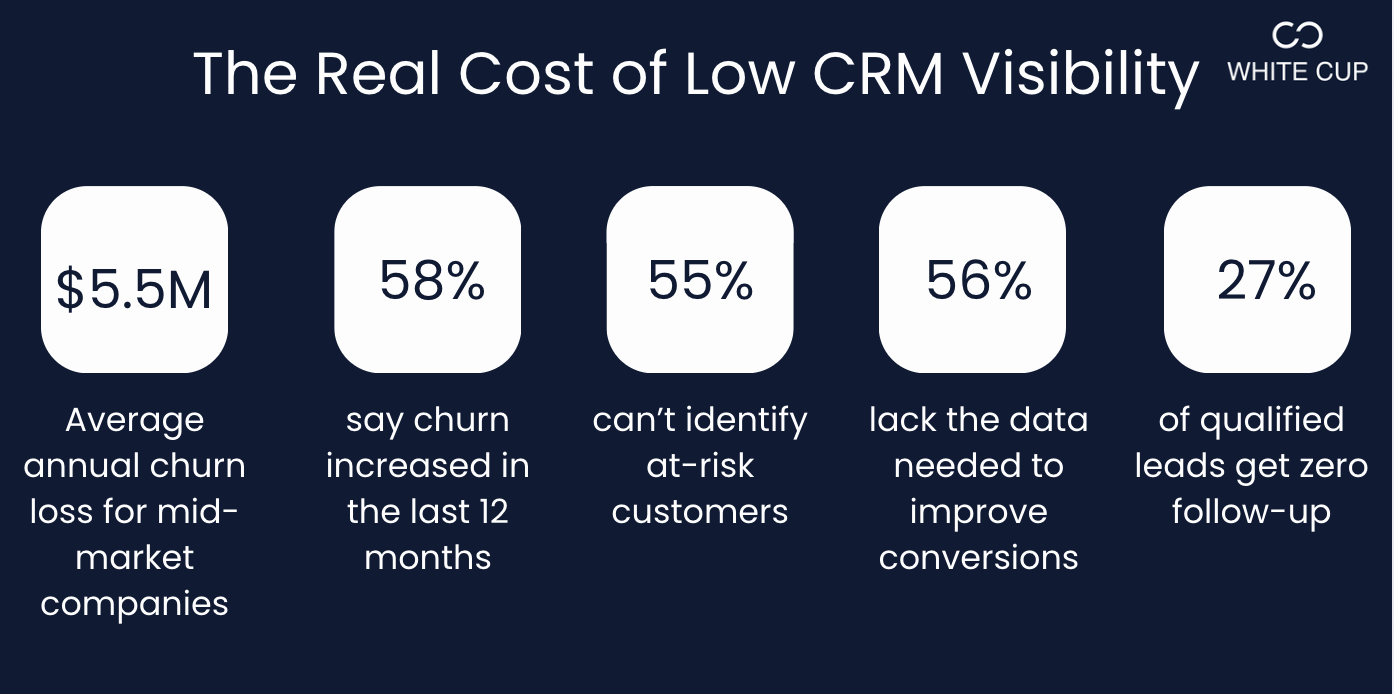
Mid-market companies lose an average of $5.5M a year to customer churn, and 58% say churn has risen in the past year. Visibility issues make it worse. Nearly 55% of teams can’t identify which customers are at risk, 56% say they lack the data needed to improve conversions, and 27% of qualified leads receive no follow-up at all[3]. For distributors who depend on repeat orders and long customer lifecycles, these gaps directly reduce retention, pipeline accuracy, and margin.
That’s why you need to track the right CRM metrics to confirm whether visibility is improving and revenue risk is actually shrinking.
| 💡Distributors using a purpose-built CRM report closing deals 30% faster and lifting average deal value by up to 20%. Curious how they did it? Read our article on CRM for distributors: the returns they see |
Key Metrics & Signals to Monitor When Optimizing Your CRM
To know whether your CRM is becoming a reliable system of record, you need clear signals that track usage, data accuracy, and pipeline health.
Sales pipeline health indicators (deal age, follow-up lag, pipeline leakage)
Pipeline health shows whether reps are moving deals with intent or letting them stall. Deal age tracks how long an opportunity has been open compared to your typical sales cycle. If it sits past that window with no activity, it’s at risk. Pair that with follow-up lag, which highlights gaps between customer activity and rep response. Then track pipeline leakage to see where qualified opportunities drop out with no clear reason. Together, these indicators show whether the CRM is giving you visibility into demand, rep activity, and where revenue is at risk.
Customer engagement and retention signals (repeat purchase rate, margin erosion)
Engagement and retention metrics show if key accounts are healthy. Repeat purchase rate reveals if customers are ordering on schedule or pulling back. Margin erosion flags accounts buying the same products but at lower profitability due to discount creep, competitive pressure, or missed upsell signals. Tracking these patterns lets you see early churn risk and protect revenue before it drops.
Data-quality and system adoption metrics (fields completed, module usage)
Data quality and adoption metrics show whether your CRM is usable. Start with fields completed to measure how often reps enter the information needed for forecasting, account planning, and follow-up. Then track module usage to see which parts of the system are being used consistently and which are being ignored. When these numbers increase together, it indicates that the CRM is becoming a reliable source of truth.
Once you know the signals to track, the next step is putting a structure in place to improve them.
Four Steps to Optimize Your CRM for Sales Efficiency and Visibility
These steps give you a clear path to optimize the CRM so reps get a workable system, managers get reliable visibility, and leadership gets accurate forecasting.
Step 1: Clean and integrate your data sources (ERP, order history, service logs)
For distributors, this step means pulling in accurate customer records, SKU-level order history, contract pricing, credit terms, open orders, returns, and service activity. This is the foundation behind effective ERP integration for distributors and unified insights, because reliable forecasting and buying-cycle analysis only work when the CRM reflects real transactional data.
Step 2: Tailor workflows and follow-up prompts to how distributor sales actually work (reorders, credit terms, multi-item SKUs)
The next step is building workflows that track reorder cycles, flag changes in buying frequency, highlight credit-term issues before they block an order, and support quotes with multiple SKUs and configurations.
Follow-up prompts should align with real triggers like customers due to reorder, accounts slowing down, open quotes with no activity, margin drops, or service issues affecting the next sale.
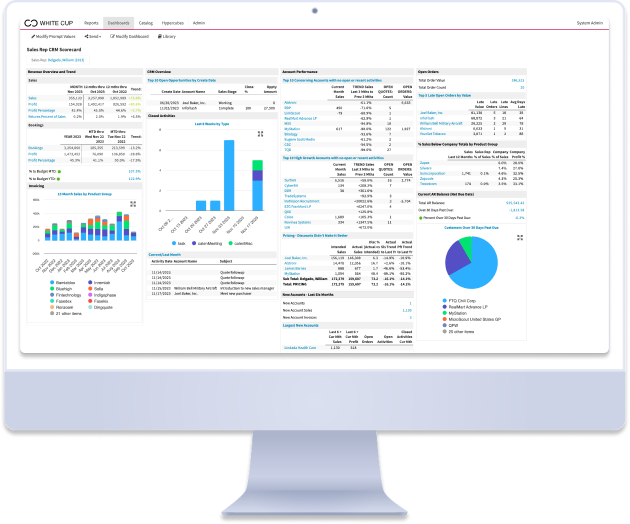
Step 3: Build role-based dashboards and visibility (outside reps, inside sales, sales manager)
Dashboards should match the work each team handles. For example:
- Field reps need a clear view of account history, upcoming reorder dates, open quotes, and recent meeting notes before every visit
- Sales teams need order status, backorders, credit holds, and service tickets to resolve issues quickly
- Sales managers need accurate pipeline data, activity trends, and margin performance to coach and forecast effectively
Step 4: Automate reminders and next-best-actions to reduce admin burden and keep deals moving
Automation in distribution only works when it’s driven by operational data like order history, buying cycles, seasonality, inventory levels, service activity, and margin shifts. A purpose-built CRM like White Cup CRM + BI turns these signals into actions reps can take immediately.
Its automations are tied directly to the patterns that affect revenue, and leverage AI to show reps what to do next, like follow up on a missed order, pitch a related SKU, re-engage a slowing account, or launch a surplus stock promotion:
- Buying Cycle Insights alert reps the moment a customer falls outside their normal reorder rhythm
- StockSense identifies surplus or at-risk inventory and auto-builds targeted buyer lists based on past purchasing behavior
- Real-time alerts notify teams when a delivery delay, credit issue, or service ticket could affect the next sale
- AI Field Notes convert meeting recordings into clean tasks, follow-ups, and summaries
Best Practices for Ongoing CRM Optimization and Adoption
CRM optimization only works when it becomes an ongoing discipline. These practices help the CRM stay aligned with how your sales teams work and ensure the system delivers value long after the initial rollout.
- Set clear governance and review cadences: Assign data owners, schedule quarterly data audits, and review workflow efficiency
- Keep the CRM simple enough for reps to use daily: Simplify screens, reduce fields, and design the user experience around real distributor tasks like reorders, quoting, and territory coverage
- Measure ROI through real revenue signals: Track changes in reorder rates, cross-sell activity, margin performance, and pipeline accuracy
- Share insights widely: Make dashboards visible across the team so reps, managers, and leadership act from the same data and can see the impact of adoption
Common Pitfalls Distributors Face and How to Avoid Them
Most CRM struggles in distribution come from predictable mistakes. Avoiding these keeps the system usable, accurate, and aligned with how your teams sell.
- Over-customizing too early before adoption: Start with core workflows and let reps use the system first; customize only after you see what is actually needed
- Ignoring the existing data problem: Clean dirty records, merge duplicates, and standardize customer naming before building dashboards or automation
- Building dashboards before defining targets: Set clear KPIs (reorder rate, margin slip, account activity) before creating reports teams won’t use
- Relying on features over adoption: Don’t assume a new tool fixes behavior; train reps on real distributor tasks so they stop reverting to spreadsheets
Conclusion: Making CRM Optimization a Revenue Engine, Not a Project
When the system delivers accurate data, clear signals, and simple workflows, it becomes the place reps go to plan their day and the single source managers rely on to coach and forecast.
Here’s a quick recap for distribution leaders:
- Start with CRM workflows that match core distributor motions
- Build on that by standardizing ERP–CRM data for consistent records
- Layer in simple, role-specific UX so reps move faster with less admin
- Strengthen adoption by training teams on revenue-driving outcomes
- Expand impact by automating actions tied to buying cycles and account behavior
- Maintain performance through regular reviews of data quality and workflows
- Measure long-term success by tracking adoption through outcomes, not logins
And finally, measure success over time. In the first 30 days, look for clean data, higher CRM usage, and better visibility into account history and open quotes. By 90 days, you should see gains in reorder capture, fewer stalled opportunities, and earlier signals on margin shifts or slowing accounts. By day 180, the CRM should consistently influence revenue through stronger retention, more accurate forecasts, increased cross-sell activity, and higher overall account performance.
Build that loop, and CRM optimization becomes a revenue engine.

Sources:
- HG Insights, CRM Market Share, Size & Buyer Trends Report, 2025. https://hginsights.com/resource/crm-market-share-report/
- Validity, The State of CRM Data Management in 2025. https://www.validity.com/resource-center/the-state-of-crm-data-management-in-2025/
- Sugar CRM, The CRM Impact Report https://www.sugarcrm.com/au/content/crm-impact-report/
Written By
