
Improving Distributor Margins with Business Intelligence-Driven CRM Workflows
As costs rise and customer pricing pressure grows, distributor margins get tighter and tighter. Most teams have the data to address margin challenges, like sales histories, quotes, and inventory trends, but it’s scattered across systems and rarely aligned.
When business intelligence (BI) and customer relationship management (CRM) workflows integrate, data becomes usable. They show which customers are at risk, which products deliver the highest distributor margins, and where process inefficiencies eat into profit.
In this article, we look at how connected CRM and BI systems help distributors protect margins at every level. They improve visibility, automate pricing control, eliminate profit leaks, and turn data into daily action across sales and operations.
Why Margins Are the Lifeblood of Distribution
In distribution, revenue growth without margin growth is a red flag. Sales can rise, but if supplier costs, freight rates, or discounting grow faster, profitability falls. Margins fund every part of a business, including inventory, payroll, credit, and expansion.
Distributors face margin pressure from three main sources:
- Price volatility makes it difficult to pass cost increases to customers quickly [1]
- Logistics and carrying costs continue to climb as inventory levels and storage expenses increase faster than demand [2]
- Competitive discounting remains common, especially in sectors where customer retention depends on price [3]
In fact, 53% of distributors report higher sales, but only 49% report higher profits [4]. That gap shows how often revenue grows faster than margins. Distributors sell more, but rising costs, discounts, and uneven pricing offset the gain. The result is higher volume on paper, but weaker profitability in practice. In a low-margin business, protecting those profit points is the most reliable sign of stability.

Figure 19–20: Year-over-year comparison showing more distributors reported sales growth than profit growth in 2024. Source
How BI + CRM Workflows Combine to Defend Margin
Defending distributor margins starts with visibility. With a CRM–ERP Integration, margin data from ERP and sales history flows directly into your BI. Every quote and discount can trigger an alert or rule before it’s approved. Managers see where profit is being given away, and reps get live guidance that keeps deals within target thresholds.
Here’s how a platform like White Cup CRM + BI transforms margins in distribution:
- Live ERP price-book integration ensures reps quote using real contract rates, preventing accidental discounting below margin floors.
- Real-time inventory visibility eliminates rush shipping costs by confirming stock before quotes go out.
- BI-powered alerts and forecasts identify margin risks early, so purchasing and sales teams can adjust before costs hit the bottom line.
- Opportunity and pipeline widgets spotlight where margin erosion happens most: by rep, product line, or territory.
- Sales rep scorecards track margin performance daily, helping managers coach proactively instead of reviewing losses after the fact.

White Cup CRM + BI Sales Rep Scorecard gives distributors real-time visibility into sales, margin, and account performance, helping teams track profit goals and act on every opportunity
Workflow Use Cases That Boost Margins
These workflow examples show why margin protection is one of the key advantages of CRM for distributors, bringing consistency, visibility, and control to every quote and order.
- Margin alerts on quotes below threshold: The CRM automatically flags any quote that falls under your target margin. Reps get instant alerts inside the quoting screen, so they can adjust pricing or request approval before a quote goes out.
- Automated escalation for high-risk deals: When a deal exceeds discount limits or dips below your minimum margin, it routes directly to a manager for review. This keeps pricing aligned and prevents profit loss from unapproved discounts.
- Cross-sell and upsell prompts by margin potential: The system analyzes past orders and recommends complementary or higher-margin products, helping reps increase average order value while staying within margin goals.
- Real-time profit visibility in a single view: As quotes are built, live profit calculations update by line item, showing the impact of every change.
- Automatic reporting on margin trends: BI reports summarize distributor margins by industry, territory, or product group. Leaders see exactly where profitability is improving and where action is needed.
| Want to see how a HVACR distributor lifted margins by 8.6%? This nationwide company wanted to fix inconsistent, manual pricing that was causing profit losses and confusion across branches. With White Cup Pricing powered by epaCUBE, they built a unified pricing structure, automated weekly scorecards, and gained complete visibility into pricing performance, resulting in 8.6% higher margin dollars and faster, more consistent updates company-wide. |
4 Steps to Build BI-Driven Margin Workflows in Distribution
Based on White Cup’s experience helping 850+ distributors strengthen profitability, these four steps show how to build BI-driven workflows that protect every margin that distributors depend on. A connected approach, like linking ERP, CRM, and BI, creates the visibility and control needed to manage pricing, reduce leaks, and safeguard profit at every stage of the sales process.
Here’s how to do it right:
1. Define your margin floors and acceptable ranges
Pull three to five years of historical data from your ERP and BI, like average selling prices, landed costs, freight charges, and gross margin by SKU or customer. Segment this data by product line, supplier, and customer type.
All-purpose CRMs rarely provide this depth of financial history, which is why distributors need BI insight to set accurate targets.
Ask questions like: Which categories consistently fall below our target margin? Where do freight and rebates distort true profit?
Use these patterns to set floor margins by category and create “acceptable variance” ranges (for example, ±1.5% from average margin). Any quote that dips below the ‘floor’ can automatically trigger a review in the CRM.
2. Integrate ERP cost and pricing data with your CRM and BI
A purpose-built CRM for distributors connects live ERP data such as current cost, price-book updates, freight surcharges, and rebate adjustments. This ensures every quote uses the latest landed cost and prevents profit leaks from outdated pricing.
With BI plugged in, teams can track cost volatility by vendor, compare quoted vs. realized margin, and forecast the impact of supplier increases before they hit orders.
3. Map workflows where margin risk is highest
Review transaction-level BI reports to find patterns of margin loss. Look for spikes in price overrides, high freight write-offs, or frequent adjustments on specific SKUs.
Then build workflows that add control at those points, like automatic manager approval for quotes below floor, alerts when discount percentages exceed a set range, or BI-driven prompts suggesting alternative products with higher margin contribution.
4. Test, monitor, and iterate
Pilot these workflows with one branch or product line. Use BI dashboards to monitor KPIs like margin per rep, average discount percentage, quote-to-order margin variance, and SKU-level margin recovery rate.
Track improvement over 30, 60, and 90-day cycles, then fine-tune approval thresholds or margin alerts before scaling.
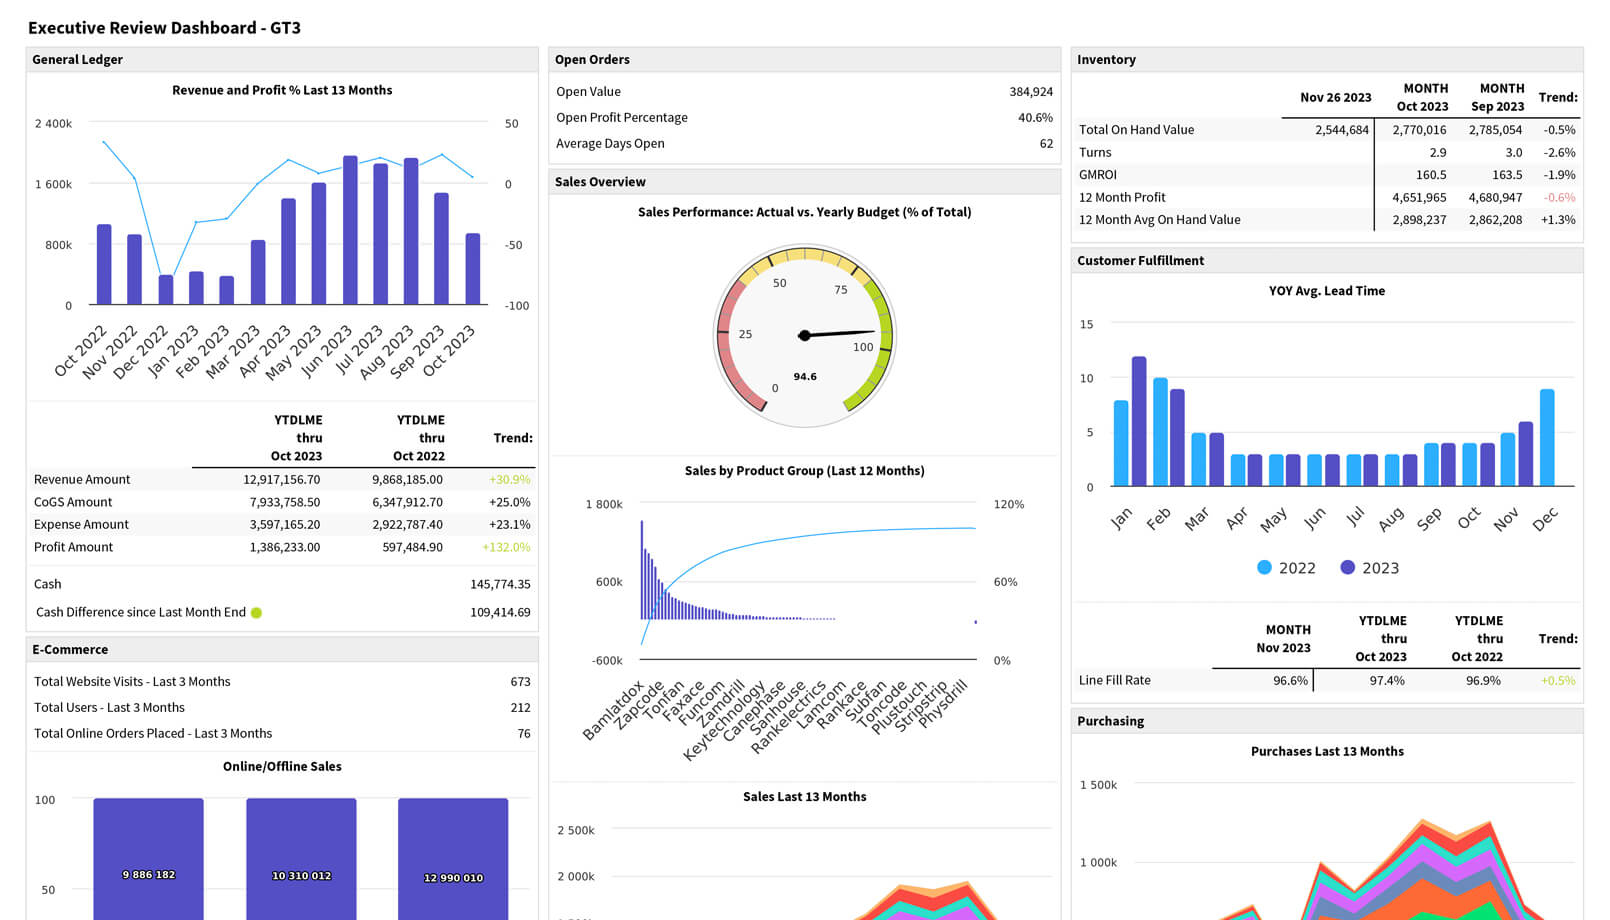
White Cup BI Executive Review Dashboard gives distributors a live view of revenue, profit, and performance metrics to protect margins and make faster decisions.
Common Challenges & Safeguards to Watch For
Margin protection depends on accuracy, timing, and control, but each of those brings its own risks. Here’s what to watch for and how to prevent small issues from turning into bigger problems:
- Data latency or mismatch between systems: If your CRM, BI, and ERP don’t sync in real time, you risk triggering alerts from outdated cost or pricing information. To prevent this, align data refresh intervals—hourly or daily, depending on transaction volume. Validate that cost and list price fields match across systems before enabling automation.
- Workflow conflicts or overlapping logic: As you add new automations, it’s easy for approval rules to clash. For example, a price override trigger may duplicate a freight-variance alert, creating confusion or duplicate escalations. Use a single workflow map to document all approval paths, ensuring each rule has a clear purpose and no step overrides another.
- Over-automation that blocks sales momentum: Too many triggers can slow down quoting and frustrate reps. Limit alerts to high-value exceptions such as quotes exceeding a discount or margin threshold, and let smaller variances flow through automatically.
- Ensuring human override and auditability: Give managers authority to override workflows when justified, like honoring a long-term contract or correcting a supplier error. When a manager approves an override, capture a short note explaining why the change was made so the business can track patterns, verify compliance, and adjust pricing rules where needed. BI then logs these exceptions to show where policy or process changes may be required.
What to Look for in a CRM + BI Platform for Margin Protection
Margin protection is about connecting the tools you already rely on. Distributors need a platform that ties pricing, cost, and customer data together in real time, so sales decisions always reflect what’s happening in the business.
That’s why distributors choose White Cup CRM + BI. The platform integrates directly with your ERP, giving you live visibility into pricing, margin, and performance without the delays or guesswork of disconnected systems. Automated margin alerts, role-based dashboards, and built-in reporting keep every quote and approval aligned with profit goals.
In a business where every point of margin counts, White Cup turns data into decisions into dollars.
Sources:
- CIBC Capital Markets USMMIB: Distribution Market Update Q4 2024 https://cms.cibcusmmib.com/wp-content/uploads/2024/12/Q4-Distribution-Market-Update-Final.pdf
- MDM 2025 Annual Economic Outlook: Forecasts & Benchmarks for Wholesale Distribution (MDM Research, NAW) https://www.mdm.com/wp-content/uploads/2025/08/MDM_2025_EOR_Blurred.pdf
- MDM Research: Distributors’ Top Concerns to Start 2025 https://www.mdm.com/company_article/research-distributors-top-concerns-to-start-2025/
- PPAI 2024 U.S. Distributors’ Promotional Products Sales https://www.ppai.org/wp-content/uploads/2025/02/2024-PPAI-Sales-Volume-Report.pdf
Written By
